01
The physics of PET
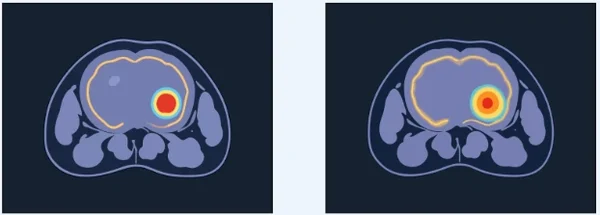
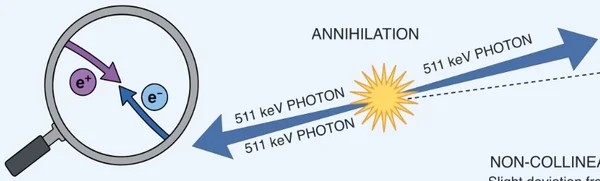
From radioactive decay to the image: positron range, annihilation, and why different tracers produce sharper or blurrier lesions.
Radionuclide decayPositron rangeAnnihilationClinical impact

Work / PET imaging illustration series
Infographics · Medical scienceA comprehensive series of medical and scientific graphics explaining advanced PET imaging concepts, from the physics of positrons to detector technology and AI, for education and clinical communication.
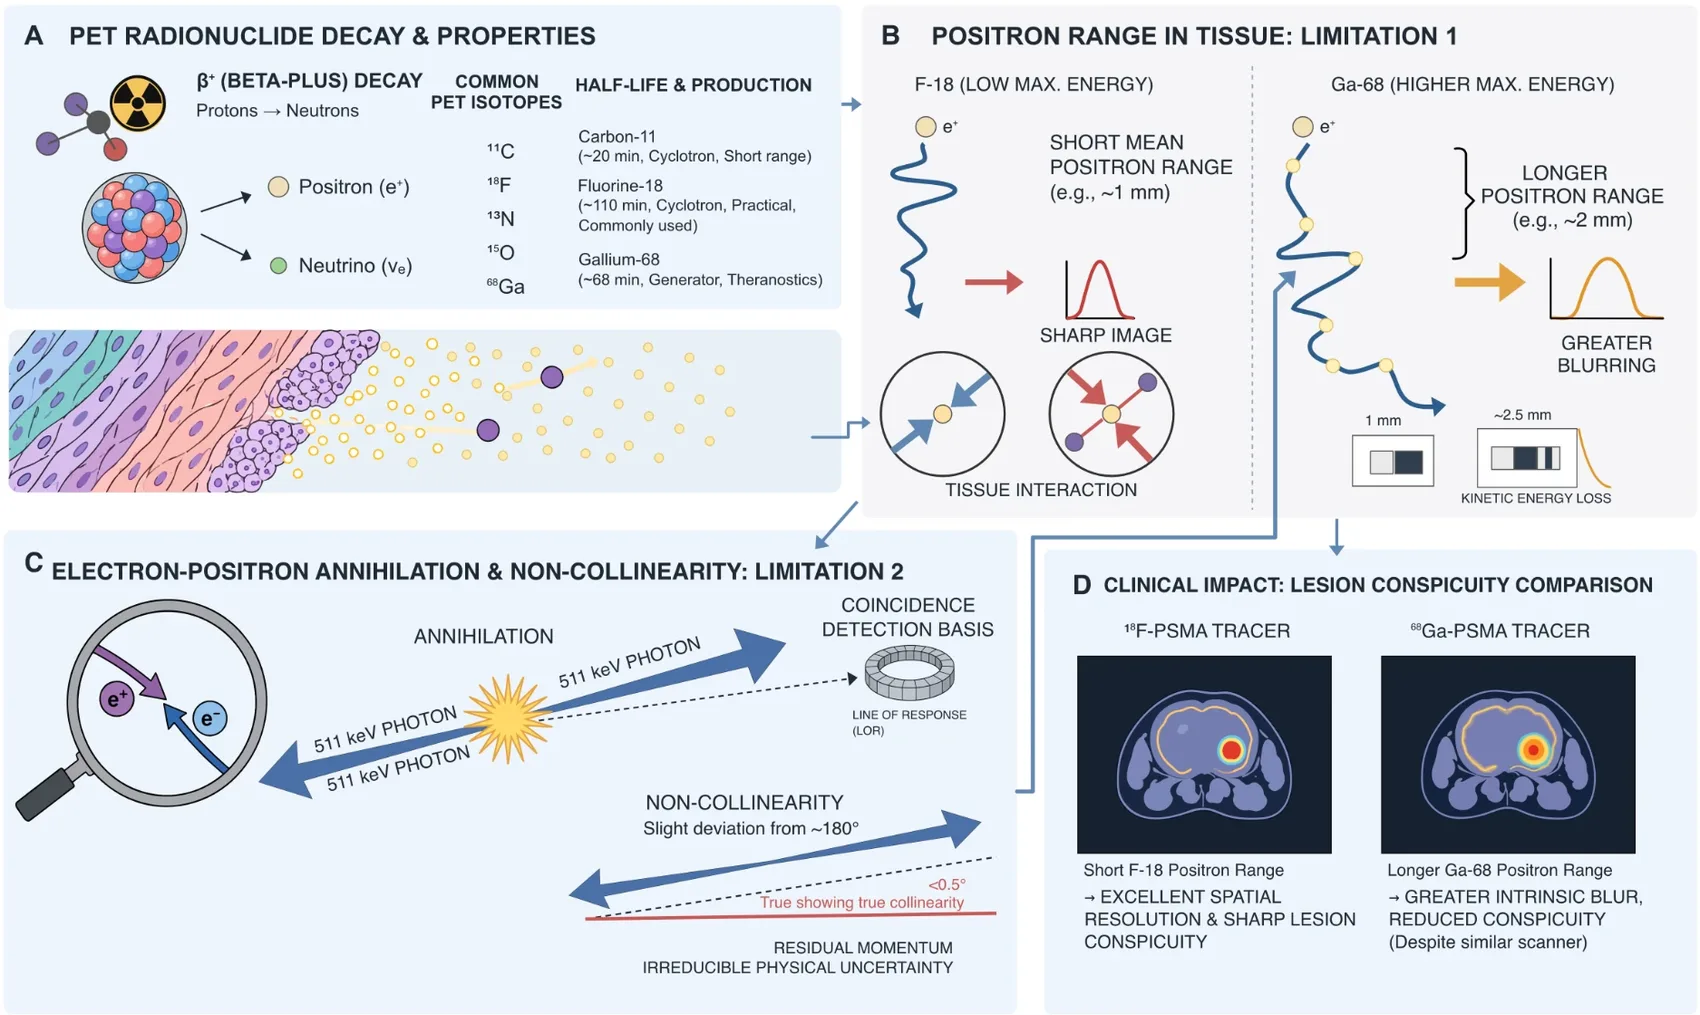
PET imaging is full of concepts that are hard to explain in words: positron range, time-of-flight, depth of interaction, non-collinearity. The client needed visuals that make them clear without sacrificing accuracy.
We translated each topic into a structured, labeled plate, combining technical diagrams, comparison charts, scanner graphics, and simplified anatomy in one consistent professional style.
Read them in order like chapters of a guide. Click any plate to see it full size.
From radioactive decay to the image: positron range, annihilation, and why different tracers produce sharper or blurrier lesions.
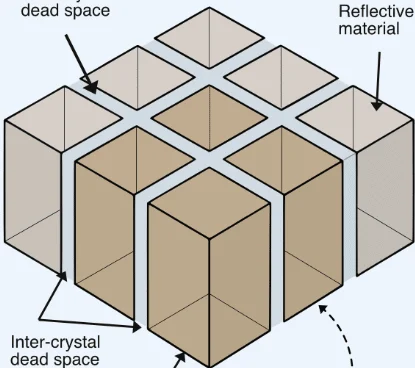
Three ways to structure scintillation crystals, from pixelated arrays to monolithic blocks, shown as a continuum rather than a binary choice.
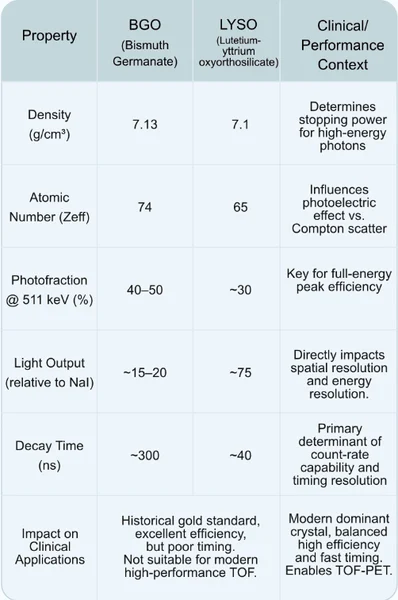
How a detector turns a photon into a signal, how BGO and LYSO crystals compare, and what the shift from analog to digital means clinically.
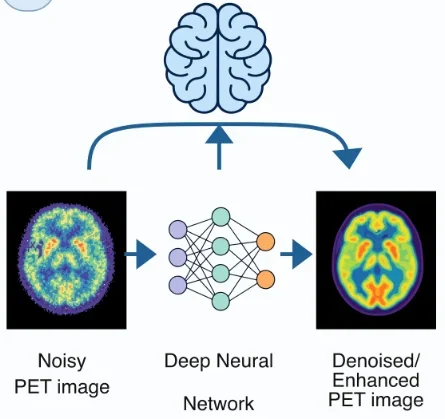
Deep-learning denoising for low-dose scans, paired with the validation criteria clinicians need before trusting the result.
New scanner designs and imaging methods, from walk-through PET to Compton cameras and dual-photon imaging.
Each plate mixes different kinds of graphics, all drawn to the same standard so they can be reused across materials.
We turn technical, medical, and scientific topics into clear, accurate infographics and illustrations.